Agency Financial Dashboard Finally visible.
Seven dashboards. Revenue pipeline, project health, client risk, pending approvals. Real-time data that turns chaos into clarity.
One command center. Every metric that matters.
The whole picture.
In one scan.
Total Revenue
$147K
All paid invoices in period
Pending Revenue
$24.7K
Invoices sent, awaiting payment
Active Projects
23
Currently in progress
Total Clients
48
Across all workspaces
$147K
Paid invoices this period
$24.7K
Sent and awaiting payment
$5.4K
Past due date
$38.2K
Total pending value
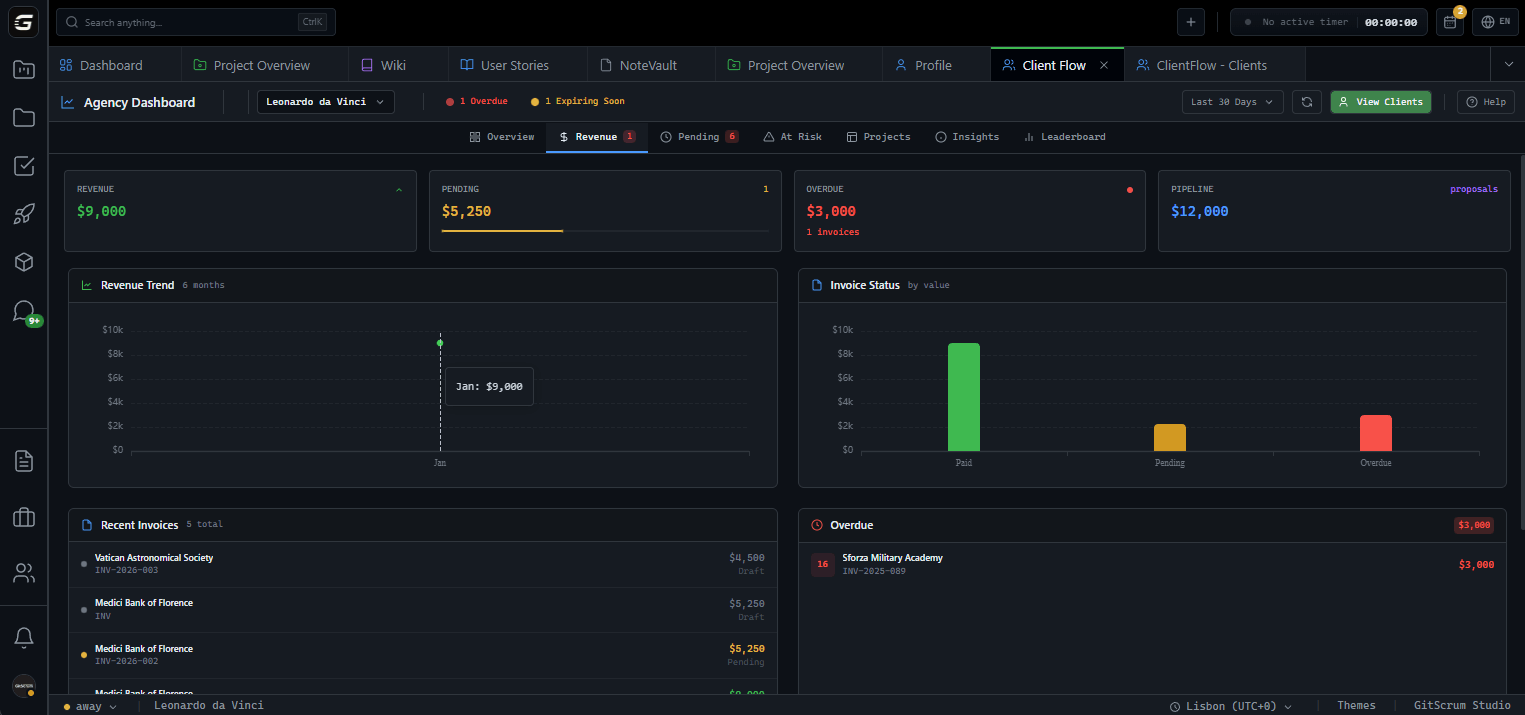
Follow the money.
From proposal to paid.
Monthly trend charts, invoice status breakdown, recent invoices, overdue tracking, pending proposals. Know exactly where every dollar sits.
Problems surface.
Before they explode.
Overdue invoices, stalled projects, expiring proposals. Automatic detection with risk heatmap visualization.
Overdue Invoices
14+ days past due with total amount
Stalled Projects
No activity for 14+ days
Expiring Proposals
Due within next 7 days
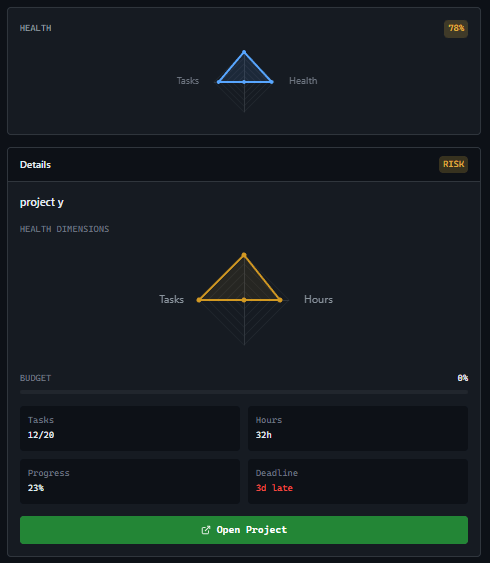
Project radar.
Nothing escapes.
Budget utilization, task progress, health scores. Radar charts per project. Spot troubled projects before clients complain.
Health Score Algorithm
100 base score. -30 if budget >90%. -30 if overdue tasks + incomplete. Real-time calculation.
Deep client insights.
Per client.
Lifetime value, conversion rates, revenue trends, proposal funnels. Drill down into each client's financial history and project performance.
Lifetime Value
GreenTotal revenue per client over time
Conversion Rate
YellowProposals accepted vs. sent
Revenue Trends
BlueMonthly revenue charts per client
Acme Corporation
Champion Client
$284.5K
32% of revenue
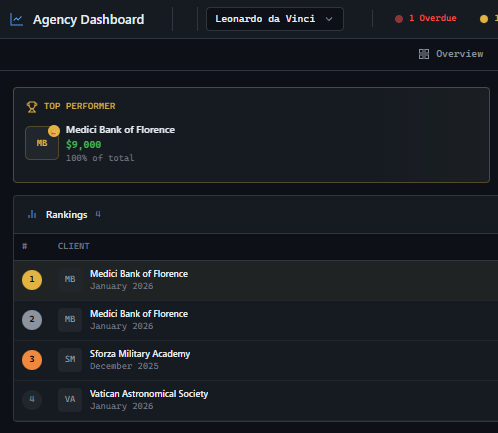
Know your best.
Nurture them.
Rank clients by revenue, projects delivered, budget utilization. Revenue treemap shows concentration. Know who matters most.
Any period. Your choice.
MTD, last 30 days, QTD, last 90 days, YTD, last 6 months. Every dashboard respects your date selection.
Your team can't see this.
Client Flow Dashboards are locked to Agency Owners only. Financial data stays at the executive level. Managers and developers see project work, not client revenue.
GitScrum vs. alternatives
| GitScrum | Spreadsheets | Project Tools | |
|---|---|---|---|
| Revenue pipeline tracking | Full visualization | Manual formulas | Not available |
| Automatic risk detection | Automatic alerts | Manual checks | Limited |
| Project health scoring | Algorithm-based | Not available | Basic status |
| Client financial analytics | Lifetime value tracking | Manual tracking | Not available |
| Client leaderboard | Multi-criteria | Manual sorting | Not available |
| Flexible date ranges | 6 presets | Manual filtering | Basic |
| Agency owner only access | Built-in | Everyone sees | Complex setup |
Questions
Can't find what you're looking for? Contact our team.
Who can access Client Flow Dashboards?
Only Workspace Owners (Agency Owners) can access these dashboards. Managers, developers, and clients cannot see financial data—it's executive-level visibility only.
How does risk detection work?
The system automatically flags invoices 14+ days overdue, projects with no activity for 14+ days, and proposals expiring within 7 days. Risk heatmap shows distribution across clients.
What is the health score algorithm?
Projects start at 100. Budget usage over 90% deducts 30 points. Overdue tasks with incomplete work deducts another 30. Below 70 is 'Warning', below 40 is 'Critical'.
Can I customize date ranges?
GitScrum provides 6 preset periods: MTD, Last 30 Days, QTD, Last 90 Days, YTD, and Last 6 Months. All dashboards respect your selection for consistent analysis.
What does Client Financial Analytics show?
Each client profile includes lifetime value, proposal conversion rate, revenue over time charts, invoice status distribution, deal lifecycle pipeline, and team work rates. Complete financial history per client.
What does the client leaderboard show?
Rank clients by revenue (lifetime value), projects delivered, or reliability score. Revenue treemap visualizes concentration. Detail panel shows full client profile.
Are the charts interactive?
Yes. Radar charts, heatmaps, treemaps, and trend lines are built with ECharts. Hover for details, click to drill down into specific data points.
Can I export dashboard data?
Dashboard data can be exported for reporting. Each view provides actionable data that can be used in client presentations or internal reviews.
Stop flying blind.
Client Flow Dashboards give you complete financial visibility across your agency. Every metric. Every risk. Every opportunity. Real-time.
No card required · Built for agencies · 5-minute setup


