Project Visibility for Managers
Portfolio view of every project.
Real-time alerts when work goes off track.
Sprint analytics that actually predict delivery.
GitScrum: Built for leaders who make decisions with data, not guesses.
Start shipping. No card needed.
See every project. Know which ones are dying.
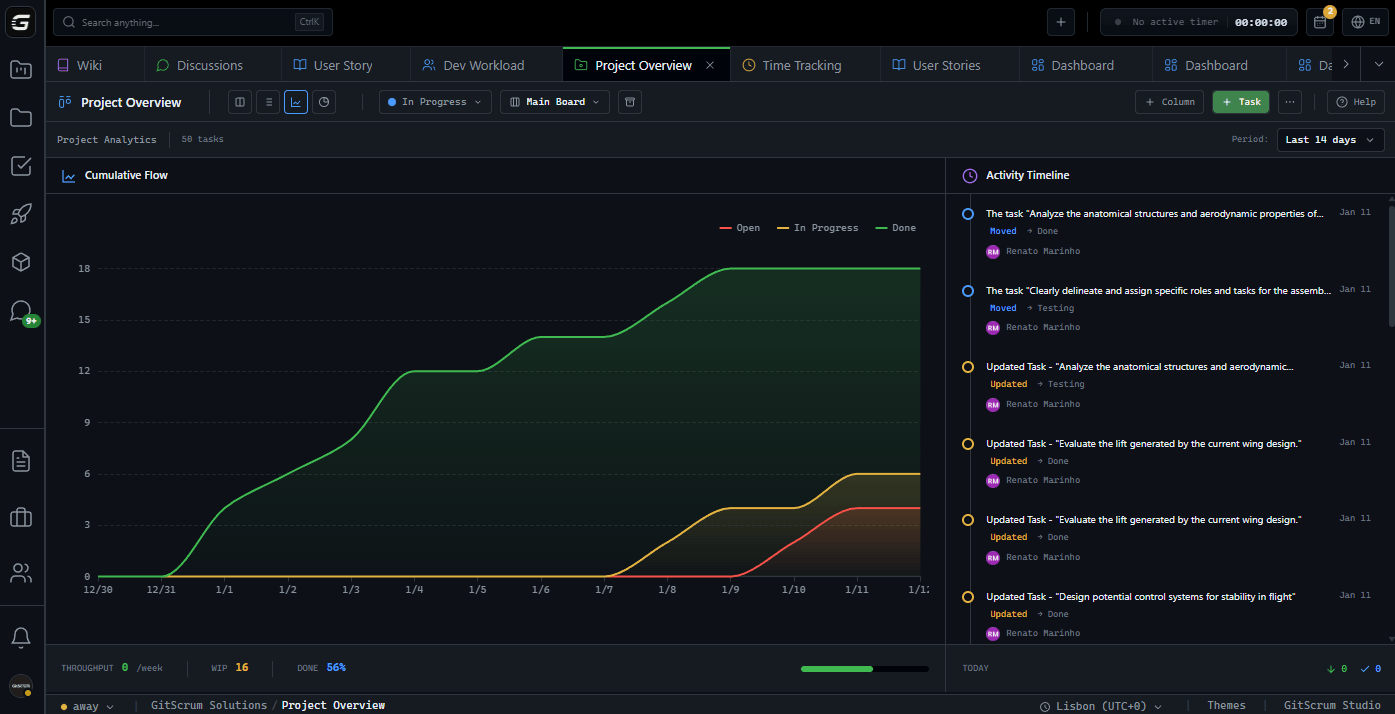
Workspace reports across all projects. Filter by team, client, period. See budget consumed, tasks completed, time logged—side by side. Projects trending over budget? Late deliveries? Zero activity? You know where to focus before the client calls.
Velocity compounds. Estimates get smarter.
Burndown, velocity, completed vs. planned—all in one view per sprint. Compare current sprint against past sprints. Your team's velocity stabilizes. Your estimates stop being guesses. You commit with confidence.
Blockers surfaced. Momentum tracked.
Daily standup log from every teammate. What they shipped yesterday. What ships today. What's blocking. Full history per member so you spot impediments fast. One dev always blocked on the same thing? You catch it.
Monitor all projects across teams and clients in real-time.
AI-driven forecasts for project completion and budget needs.
Automated alerts for projects at risk of delay or overrun.
Track individual and team productivity metrics.
Real-time monitoring of project budgets vs. actual spend.
Optimize team assignments across multiple projects.
Data-driven sprint planning with historical velocity.
Track code quality, testing coverage, and defect rates.
Automated reports for client updates and demos.
Keep all stakeholders informed with automated updates.
Identify bottlenecks and improve team workflows.
Compare performance across sprints and projects.
Distribute work evenly across team members.
Track dependencies between projects and teams.
Set and track strategic priorities across initiatives.
Track scope changes and their impact on timelines.
Improve delivery predictions with historical data.
Track skill growth and training effectiveness.
Monitor regulatory and quality compliance metrics.
High-level views for strategic decision making.
Rapid response tools for project emergencies.
Define and track key performance indicators.
Collect and analyze stakeholder feedback systematically.
Track process improvements and their impact.
Monitor R&D projects and innovation initiatives.
Every project. Every team. One dashboard.
Six data streams that tell you exactly where to focus. No more status meetings. No more "can you update the spreadsheet?"
Portfolio Overview
All projects. Real-time.
Every project in one view.
12 projects trackedBurndown. Velocity. Trends.
Daily updates logged.
8/8 submittedHours per project, per team.
See impediments surfaced.
2 active blockersKnow margin at a glance.
Filter by team, client, or time period. Compare sprints. Spot projects trending over budget before the client calls.
// What you see every morning
workspace.getReport({
projects: 'all',
period: 'this_sprint',
alerts: ['budget_80%', 'blockers', 'late']
 })
managers.hexagon.codeLinesNo credit card required • See all projects in under 5 minutes
Visibility without micromanagement. Control without chaos.
Six management nightmares. Six ways GitScrum eliminates them without making you the bottleneck.
Visibility Without Micromanagement
Know where work stands without asking for updates
Teams with clear visibility are 2x more likely to hit deadlines. But every "quick status check" interrupts flow. Every sync meeting is 30 minutes nobody gets back. You need to see everything without becoming the person everyone dreads.
→ The problem isn't your team hiding information. It's that visibility requires effort. Every update is manual. Every report is stale the moment it's created.
Real-time dashboards that update themselves. Progress tracking that happens automatically when work moves. Sprint burndowns that show reality, not last week's optimism. Status meetings become optional.
Auto-updating dashboards
Work moves, data updates
Progress tracking by work done
Not by reports filed
Team activity feed
Who did what, when
Sprint health at a glance
Green, yellow, red—instantly
deadline hit rate
Stalled task detection
No activity > 48h flagged
Dependency visualization
See what blocks what
Sprint risk indicators
Early warning system
Blocker age tracking
How long it's been stuck
earlier detection
Bottleneck Detection Engine
Spot blockers before they become disasters
By the time someone tells you about a blocker, it's been killing progress for days. Dependencies pile up. Sprints derail. The client finds out before you do. You're always reacting, never preventing.
→ Blockers don't announce themselves. They hide in tasks that stopped moving, in dependencies nobody tracked, in assumptions that turned out wrong. Finding them requires pattern recognition across the entire portfolio.
Automatic blocker detection when tasks stall. Dependency tracking that shows what's waiting on what. Smart alerts when sprints trend off-track. See problems at "small fix" stage, not "emergency meeting" stage.
Resource Allocation Intelligence
Balance workload across teams without burning people out
50% of managers struggle with resource constraints and talent shortages. Some people are overloaded while others wait for work. You can't see who has capacity. Overcommitment happens invisibly until someone breaks down.
→ The problem isn't lack of resources. It's lack of visibility into current allocation. You're distributing work based on roles and assumptions, not actual capacity and current load.
Visual workload distribution across teams. Capacity indicators per team member. Historical patterns that show who's consistently overloaded. Allocation that balances skill, availability, and sanity.
Workload heat maps
Red = overloaded, green = capacity
Per-person task count
Current and upcoming
Time logged vs estimated
Reality vs plan
Cross-project visibility
All commitments, one view
reduced overcommitment
One-click executive reports
Generated from real data
Client portal dashboards
Self-service visibility
Business impact metrics
Not just task counts
Scheduled report delivery
Weekly, monthly—automated
saved weekly on reporting
Stakeholder Communication Autopilot
Keep executives and clients informed without constant reporting
Executives demand "visible returns" and business value, not just task completion. But every report takes hours. Every client update is a context-switch marathon. You spend more time explaining work than enabling it.
→ Reporting is manual labor disguised as communication. You're translating between systems, aggregating from spreadsheets, converting "tasks done" into "business impact." Every week. Forever.
Automated status reports generated from actual work. Client-facing dashboards they can check themselves. Translation layer that converts sprint velocity into business language. Executives see ROI, clients see progress, you see your calendar clear up.
Sprint Health Metrics That Matter
Track velocity, burn-down, and team performance in one place
Managers need data-driven insights, not gut feelings. But metrics are scattered across tools. Burndown lives in one place, velocity in another, team performance in spreadsheets someone forgot to update. Decisions happen on incomplete information.
→ The data exists. It's just fragmented. Every tool has a piece. Assembling the full picture is your job, every week, from scratch. By the time you see the pattern, it's too late to change course.
Unified sprint analytics. Velocity trends over time. Burndown with predictive completion dates. Sprint-over-sprint comparisons. All metrics auto-calculated from work data. Decisions based on reality, not reconstructed reality.
Velocity trend analysis
Sprint over sprint
Predictive burndown
When will we actually finish?
Commitment vs delivered
Accuracy tracking
Team performance patterns
What's improving, what's not
forecast accuracy
Change request tracking
Every addition logged
Scope comparison view
Original vs current
Impact assessment
Time/effort before approval
Priority audit trail
What changed, when, why
less scope creep impact
Scope Creep Defense System
Protect teams from endless change requests and priority shifts
Scope creep and unclear goals are top project killers. Every "small addition" compounds. Every priority shift resets momentum. Your team finishes sprints exhausted, having completed none of the original goals because everything kept changing.
→ Scope creep isn't malicious. It's invisible. Requests trickle in through Slack, email, "quick calls." Nobody sees the cumulative impact until the sprint is underwater. There's no paper trail showing why the original plan failed.
Change request workflow that makes scope additions visible. Original vs current scope comparison. Impact assessment before additions are approved. Priority alignment documentation. When someone asks "why is this late?", you have the receipts.
Lead with visibility. Not with interruptions.
Strategic orchestration, not task checking. That's management done right.
No credit card required • Full visibility in under 5 minutes


