Ship on schedule.
Every sprint.
Burndown charts that update in real-time. Velocity tracking across sprints. Health analysis that catches risks before they derail delivery.
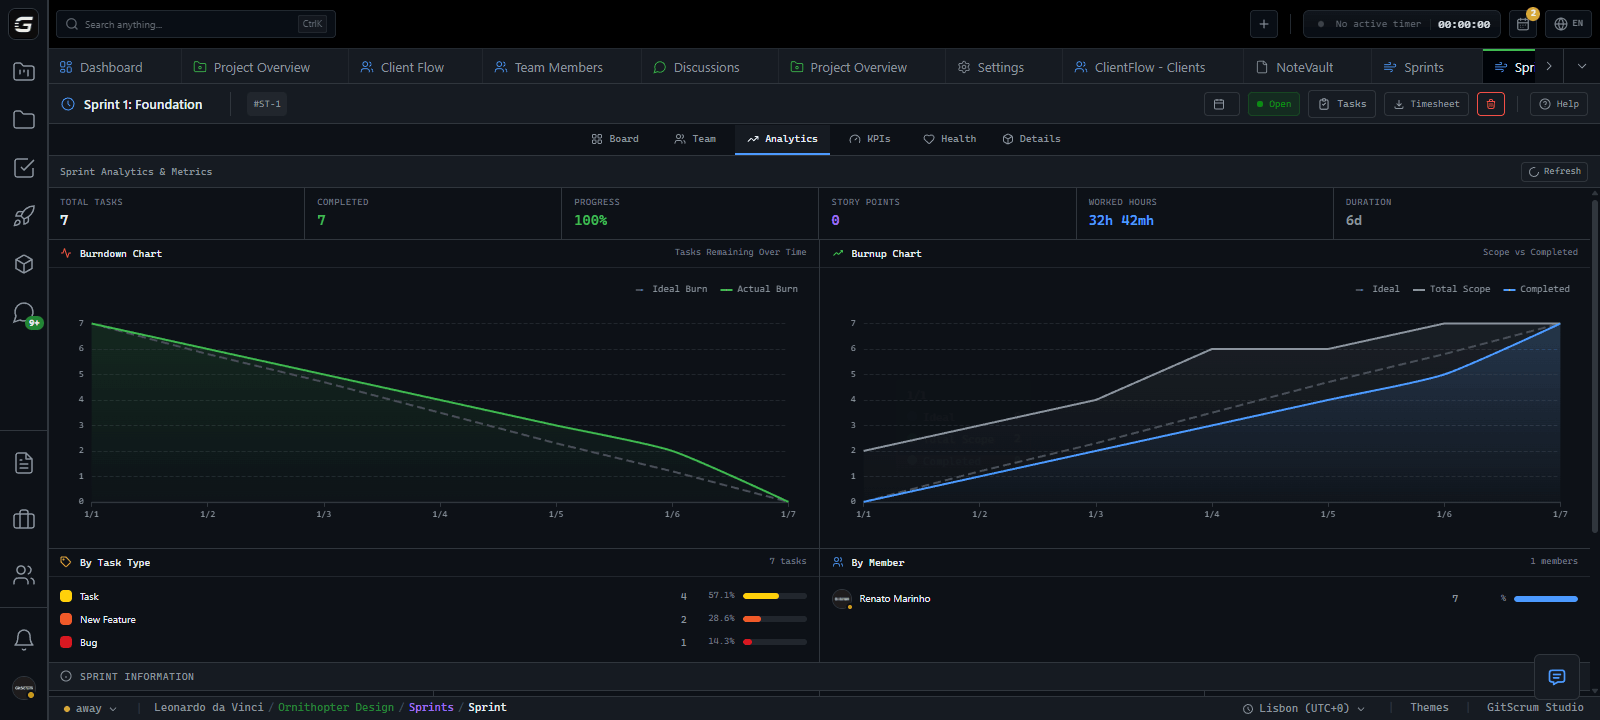
See progress instantly.
No guessing.
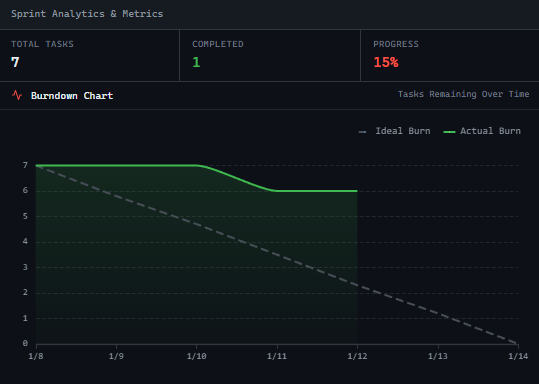
Ideal vs actual burn visualized daily. Track by tasks or story points. Know immediately when scope creep hits or velocity drops.
Measure throughput. Sprint by sprint.
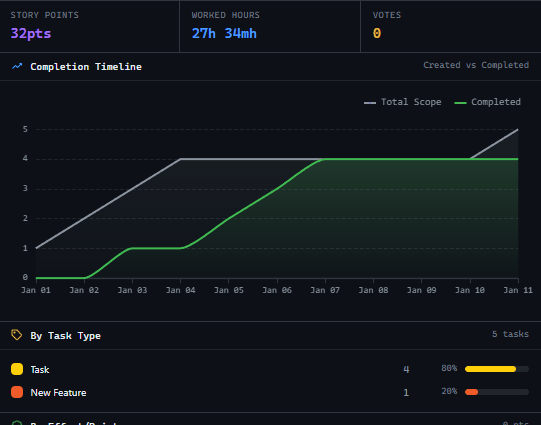
Completed story points per sprint. Historical velocity trend shows capacity evolution. Plan commitments based on actual data, not estimates.
Catch problems early.
Fix them fast.
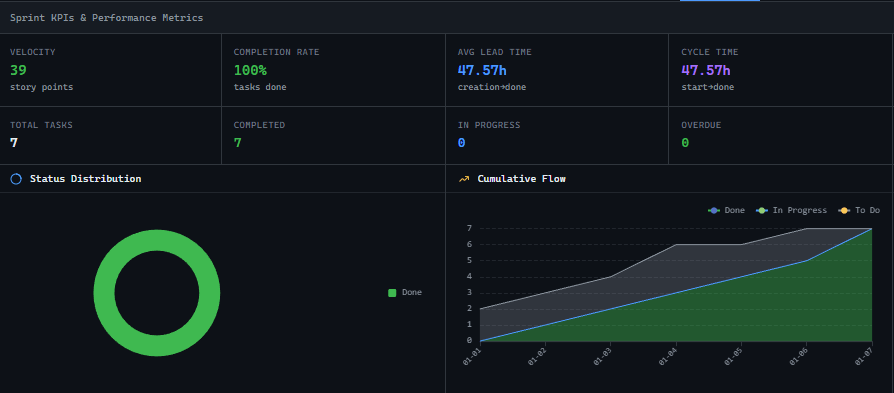
AI-powered health score analyzes progress, scope, time pressure, and quality metrics. Risk alerts surface issues before they escalate. Actionable recommendations guide next steps.
20+ metrics.
One dashboard.
Balance workload. Before it breaks.
Task distribution per team member. Completion rates by person. WIP limits visibility. Identify bottlenecks and rebalance before deadlines slip.
Retrospectives made easy. Data-driven.
Burnup charts show scope vs delivered work. Task type breakdown reveals planning patterns. Team performance trends guide capacity planning.
How Sprint Planning Works
From backlog to delivery in three simple steps
Plan the Sprint
Set dates, define goals, pull tasks from backlog. Assign story points and team members. Commit to a scope based on velocity data.
Track Progress Daily
Burndown updates automatically as tasks move. Health score monitors risks. Velocity accumulates as work completes. Team distribution stays visible.
Review & Improve
Sprint ends with full analytics. Compare velocity to historical average. Identify what worked, what didn't. Carry insights to next sprint.
Who uses Sprint Planning?
Agency Owner
Track sprint delivery across all client projects. Know which teams are on schedule, which are at risk. Invoice clients with confidence backed by real data.
On-time delivery visibilityProject Manager
Real-time sprint health without daily standups. Burndown charts, velocity trends, and risk alerts tell you everything. Focus on removing blockers, not chasing status.
Proactive risk managementDeveloper
Clear sprint scope from day one. Know your tasks, see progress, track velocity. Sustainable pace with predictable commitments based on historical data.
Predictable workloadClient
Watch your project progress in real-time. Sprint completion percentage, tasks delivered this week, upcoming milestones. Transparency without chasing emails.
Real-time project visibilitySprint Planning: GitScrum vs. Alternatives
See how GitScrum compares to other tools in the market
| Capability | GitScrum | Jira | Asana | Monday |
|---|---|---|---|---|
| Burndown Charts | Add-on | |||
| Burnup Charts | ||||
| Velocity Tracking | ||||
| Sprint Health Analysis | ||||
| Cycle Time Metrics | Partial | |||
| Lead Time Metrics | Partial | |||
| Team Distribution | Partial | |||
| Client Portal View | Add-on |
Comparison based on publicly available features. Last updated December 2024.
Frequently Asked Questions
Everything you need to know about Sprint Planning
How do I create a new sprint?
Navigate to your project, click Sprints in the sidebar, then Create Sprint. Set the start date, end date, and optionally a sprint goal. Tasks can be added immediately or later from your backlog.
What's the difference between burndown and burnup charts?
Burndown shows remaining work decreasing over time. Burnup shows completed work increasing plus total scope. Burnup is better for visualizing scope creep since it shows both lines diverging when new work is added mid-sprint.
How is velocity calculated?
Velocity is the sum of story points (effort) for all completed tasks in a sprint. Only tasks that reach a closed status by the sprint end date count toward velocity. Historical velocity is the average of your last 3 completed sprints.
Can clients see sprint progress?
Yes. Clients with portal access see sprint completion percentage, tasks completed this week, and overall progress. They can't edit sprints or modify tasks—view-only access keeps them informed without risking scope changes.
What happens to incomplete tasks when a sprint ends?
Incomplete tasks remain in the sprint by default for historical accuracy. You can manually move them to the next sprint or back to the backlog. The KPI dashboard will show them as incomplete in velocity calculations.
How does health analysis work?
Health analysis combines progress vs expected, scope changes, overdue tasks, WIP count, rework rate, and team distribution into a weighted score. It identifies risks like schedule slippage, scope creep, or quality issues and provides actionable recommendations.
Start Shipping Sprints on Time
Real-time burndown, velocity tracking, and health analysis. Everything you need to deliver predictably.
No credit card required • Setup in under 5 minutes


