See your project like never before
Kanban, List, Analytics, Progress—four views of the same truth. Drag tasks, track flow, spot bottlenecks. Real-time updates without refresh.

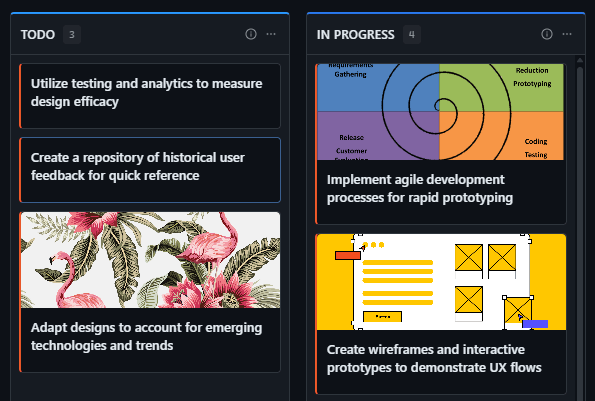
Columns that tell
the whole story
Custom workflows as columns. Tasks flow left to right. WIP limits prevent overload. Colors show task types at a glance. The board you actually want to use.
When you need the details
Same tasks, table format. Sort by any column. Filter by assignee, type, sprint. Perfect for bulk operations and detailed analysis.
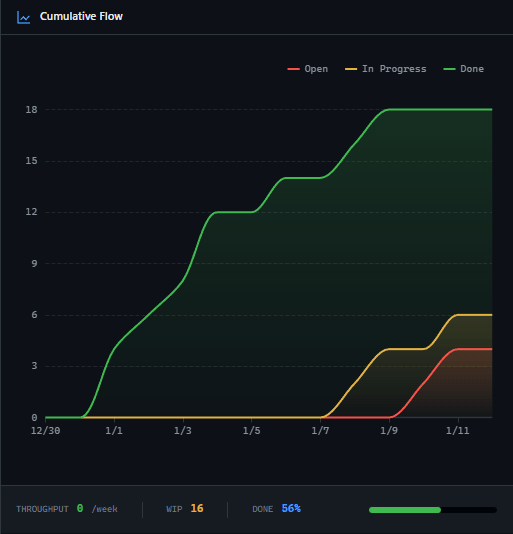
Cumulative Flow
shows the truth
CFD chart reveals bottlenecks before they kill delivery. See throughput trends. Track completion rate. Activity timeline shows who did what, when.
Completion ring at a glance
One number: how done are you? Progress ring shows completion percentage. Workflow distribution bars show where tasks are stuck. Velocity shows delivery speed.
Everyone sees the same board
WebSocket-powered updates. When someone moves a task, everyone sees it instantly. No refresh needed. Collaboration without conflicts.
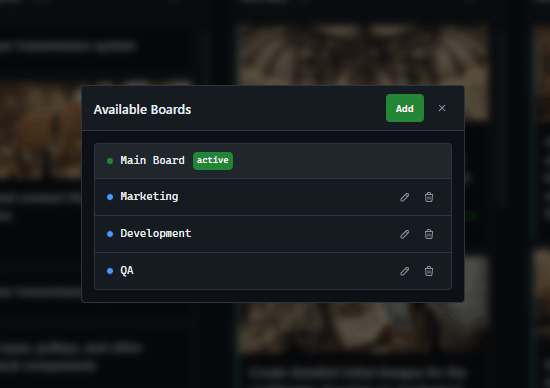
One project
multiple boards
Split work into boards. Frontend team, backend team, design team—each with their own view. Main board shows everything. Board selector switches instantly.
How Project Overview Works
From task creation to delivery tracking
Configure Workflows
Set up columns that match your process. To Do, In Progress, Review, Done—or whatever fits. Add WIP limits to prevent overload.
Manage Tasks
Create tasks, drag them between columns, assign team members. The board updates for everyone in real-time.
Track Progress
Switch between views to see the big picture. Kanban for daily work. Analytics for trends. Progress for status reports.
Who uses Project Overview?
For Agency Owners
Open any project and know its status in 10 seconds. Completion ring, CFD chart, workflow distribution—no questions needed. Multiple projects? Same clarity everywhere.
Project status at a glanceFor Managers
See who's working on what. Spot blockers in the CFD. Drag tasks to balance load. Real-time sync means no 'but I didn't see the update' excuses.
Visual management that worksFor Developers
Clear columns show what's next. Drag your task when done. No meetings to update status—the board is the status. Keyboard shortcuts speed up everything.
Less status updates, more codingFor Clients
See your project's progress without asking. Completion percentage, tasks in progress, what's done. Transparency builds trust.
Real-time project visibilityProject Overview vs Alternatives
A board that helps you ship, not just track
| Capability | GitScrum | Jira | Trello | Asana |
|---|---|---|---|---|
| 4 integrated views | ||||
| Real-time WebSocket sync | ||||
| CFD analytics built-in | Paid | |||
| WIP limits per column | Paid | |||
| Multiple boards per project | Paid | |||
| Progress completion ring | Paid | |||
| Activity timeline | ||||
| Drag & drop everywhere |
Comparison based on free tiers as of January 2026
Questions about Project Overview
Everything you need to know
What are the 4 views available?
Kanban (columns with drag & drop), List (table with sorting), Flow (CFD chart + activity timeline), and Progress (completion ring + workflow distribution). All show the same data, different visualizations.
How does real-time sync work?
WebSocket connection broadcasts changes instantly. When someone moves a task or updates it, all team members see the change without refreshing. Toast notifications show who did what.
Can I limit how many tasks are in a column?
Yes. WIP (Work In Progress) limits can be set per column. When exceeded, you'll see a warning. This prevents bottlenecks and keeps work flowing.
What's the CFD chart showing?
Cumulative Flow Diagram shows task counts by status over time. Widening bands indicate bottlenecks. Converging lines show good flow. It reveals problems Kanban can't show alone.
Can clients see the board?
Yes, with controlled access. Clients see tasks assigned to them or that they need to review. They can't see internal workflows or costs—just relevant project progress.
How do multiple boards work?
Create separate boards for teams or workstreams within a project. Each board has its own columns. 'Main Board' shows all tasks. Board selector in header switches views instantly.
Start managing projects visually
Kanban, analytics, real-time sync—all in one view. Get started.
No credit card required · Setup in 2 minutes


