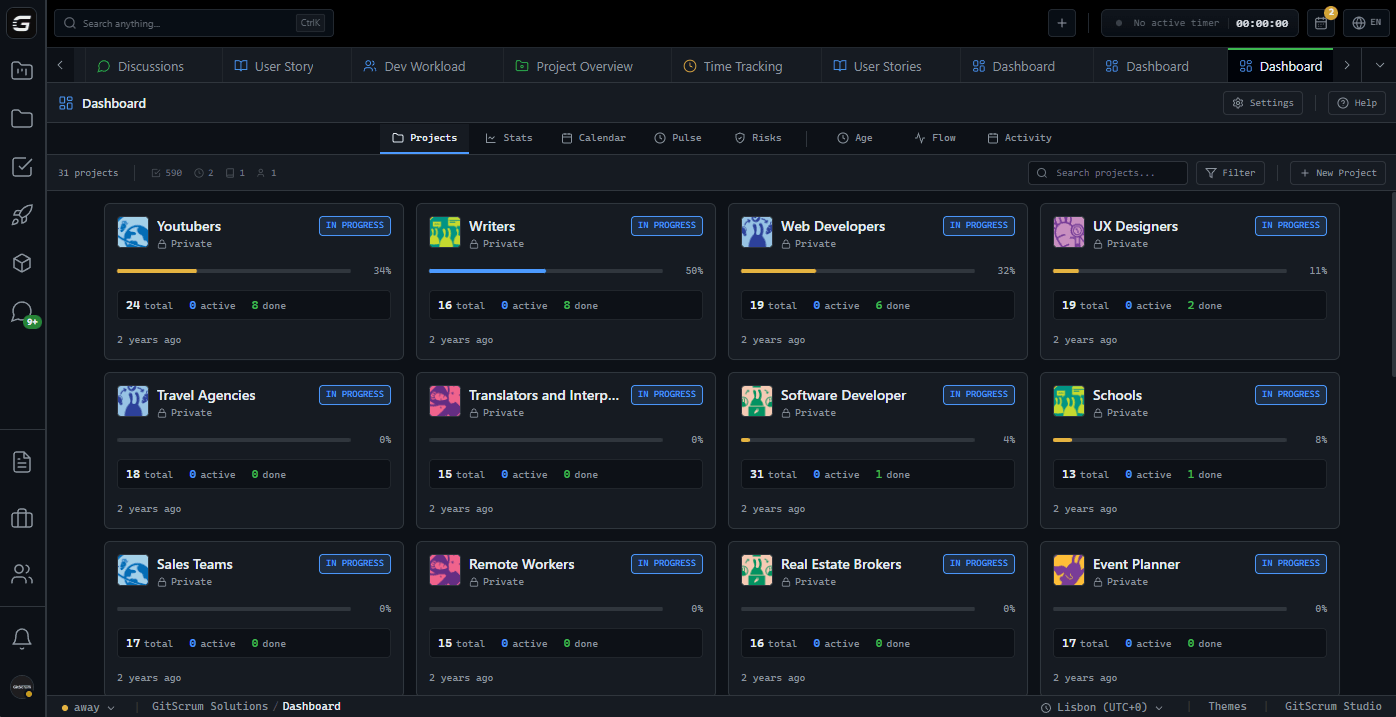
Workspace Dashboard
Control everything.
Real-time pulse of your entire workspace. 10 KPIs updating live. Risk detection that catches problems before they become fires. Zero tab-switching, zero sync meetings.
From scattered updates to single source of truth in one click
10 KPIs that matter.
Zero vanity metrics.
Total tasks waiting for progress across all projects
Tasks past due date. Click to see full list and take action
Active work happening right now across teams
Velocity indicator. Compare with previous weeks
Projects with recent activity in the last 14 days
Active contributors in the workspace
Members with active time trackers running
Tasks with blockers. Critical to unblock for flow
Tasks without owners. Assign for accountability
In-progress tasks with no activity for 7+ days
Live workspace pulse.
Not yesterday's snapshot.
See who's working on what right now. Time tracking status. Progress updates. All without asking anyone.
Live Trackers
See active time tracking sessions with task, user, and duration. Real-time updates via WebSocket
Time Intelligence
Today's hours, week's hours, billable vs non-billable. Compare with previous periods
Deadline Radar
Four-column view: Overdue, Today, This Week, No Date. Never miss a deadline again
Team workload at a glance.
Balance before burnout.
Visualize capacity across your team. Identify who's overloaded, who's available. Make data-driven assignments.
Problems found.
Before they explode.
Automated risk detection across all projects. Blocked, stale, aging, unassigned. Every risk categorized and actionable.
Blocked Tasks
Tasks with explicit blockers. Days blocked shown for prioritization
Stale Tasks
In-progress tasks with no activity for 7+ days. Likely forgotten or stuck
Aging Tasks
Open tasks older than 30 days. May need re-evaluation or splitting
Unassigned Tasks
Tasks without owners. No accountability means no delivery
Risk Score
0-100 score calculated from weighted risk factors. Critical > 50, Warning > 20, Healthy < 20
4-week velocity trend.
See the trajectory.
Created vs completed tasks per week. Net change shows if backlog is growing or shrinking. Effort points if you use them.
Bottlenecks detected.
Unblock the flow.
Workflow stages with high task counts and long average days. Find where work is piling up.
Deep-dive reports.
Beyond the dashboard.
Three specialized reports for comprehensive workspace analysis.
Cumulative Flow Diagram
Daily snapshots of Open, In Progress, Done over 30-90 days. Classic lean metric for flow visualization
Project Age Analysis
Scatter chart: project age vs completion percent. Identify stagnant projects that need attention
Weekly Activity Heatmap
GitHub-style heatmap showing activity per project over 5 weeks. Spot inactive projects instantly
Portfolio visibility.
Without micromanagement.
Running multiple client projects means constant context-switching. Status meetings eat hours. Surprises kill margins. You need a single view that tells you exactly where to focus.
Cross-Project Risk View
See all at-risk projects in one list. Prioritized by risk score. No more blind spots
Team Capacity Planning
Know who's overloaded before they tell you. Redistribute work proactively
Revenue Protection
Overdue tasks often mean delayed invoices. Catch them before they impact cash flow
I check the dashboard for 2 minutes each morning. If risk score is green, I know we're on track. If it's red, I know exactly where to dig in.
James Mitchell
Founder, Digital Agency (12 developers)
We canceled daily standups after the dashboard went live. Async updates + dashboard = better visibility with zero time cost.
Sarah Chen
Engineering Manager, SaaS Startup
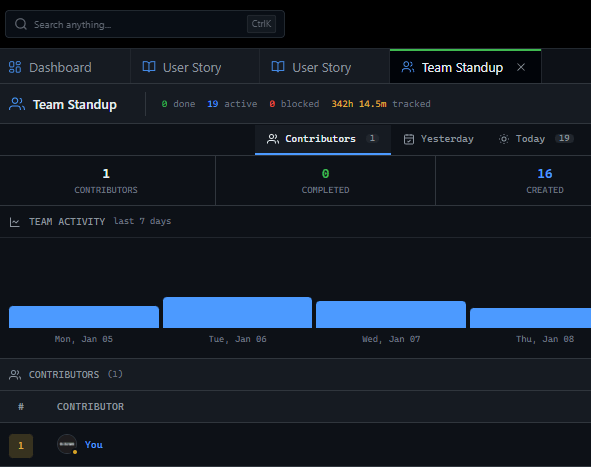
Standup in a dashboard.
15-min meeting gone.
Daily standups became status theater. Team members reciting what they did. You nodding. Nobody learning anything new. The dashboard shows all of it in real-time.
Live Progress Visibility
Who's working on what right now. Time tracking running. No need to ask
Deadline Radar
Overdue, today, this week. Organized by urgency. One click to reassign or extend
Bottleneck Detection
See which workflow stages are clogged. Take action before it blocks delivery
Technical health metrics.
Beyond task counts.
You care about code quality, technical debt, architecture. But you also need to track delivery. The dashboard gives you both without switching tools.
Stale Work Detection
In-progress tasks with no commits, no comments, no updates. Often signals blockers or scope creep
Velocity Trends
4-week trend shows if the team is accelerating or slowing. Early warning for burnout
Bug Tracking Integrated
Open bugs surfaced alongside tasks. Never lose track of quality issues
The stale task detection caught a forgotten PR that was blocking two other features. Dashboard paid for itself that week.
Marcus Rivera
Tech Lead, Fintech Platform
No setup required.
Just start working.
The dashboard reads your existing tasks, projects, and time entries. No configuration. No data entry. Real insights from day one.
Open Dashboard
Click Dashboard in sidebar. Data loads in under 500ms
Scan KPIs
10 metrics give you instant health check. Red numbers need attention
Drill Down
Click any metric to see full list. One more click to open task and take action
GitScrum vs Status Quo
| GitScrum Dashboard | Spreadsheets | Daily Standups | |
|---|---|---|---|
| Real-time updates | WebSocket live | Manual refresh | Once per day |
| Automated risk detection | 5 risk categories | Manual formulas | Verbal reports |
| Team workload view | Auto-calculated | Manual entry | Ask each person |
| Velocity trends | 4-week graph | Build yourself | Memory-based |
| Bottleneck analysis | Per workflow stage | Not possible | Discussed, not tracked |
| Cumulative flow diagram | 30-90 days | Hours to build | Whiteboard if lucky |
| One-click to action | All metrics | Copy-paste | Not applicable |
| Zero meeting overhead | Dashboard-first | Still needed | The meeting itself |
Frequently Asked Questions
Quick answers for common questions about the Workspace Dashboard
How real-time is 'real-time'?
WebSocket updates push changes within 1-2 seconds. Time trackers update every 30 seconds. KPIs use 15-second smart cache that invalidates on any relevant action.
Will it slow down with large workspaces?
No. All queries are SQL-optimized with proper indexing. We've tested with 10,000+ tasks and 500+ team members. Response times stay under 500ms.
Can I customize which metrics appear?
The KPI bar shows the 10 most impactful metrics. You can filter by project or date range. Custom dashboards are on the roadmap.
Does it work on mobile?
Yes. The dashboard is fully responsive. KPIs stack vertically on mobile. All click-to-action flows work on touch.
How is the risk score calculated?
Weighted factors: overdue tasks (25%), blockers (20%), stale tasks (15%), unassigned tasks (15%), aging tasks (15%), overloaded members (10%). Score 0-100.
Can team members see the same dashboard?
Yes. The dashboard shows workspace-level data. Team members see their own tasks highlighted. Managers see the full picture.
Does it integrate with time tracking?
Native integration. The dashboard shows live time trackers, today's hours, week's hours, billable split. All from built-in time tracking.
Can I export dashboard data?
Yes. Reports can be exported to PDF or CSV. Cumulative flow, project age, and weekly activity all have export options.
Your dashboard is ready.
No setup. No configuration. Just open it and start seeing your workspace clearly for the first time.
No credit card required · Setup in 2 minutes


