
Stop Asking 'Where's the March Report for Acme?' and Losing €1,800/Month to Report Status Chaos
If you're the analytics director or agency owner at a data consultancy with 5-20 people, you know the chaos: 30 monthly reports due in the same 5-day window. Data extraction is done for some, analysis pending for others—but you can't see which. Client asked a question last month about a traffic spike—nobody tracked it, it's not in this month's report, client is frustrated. Revision requests come via email: 'page 7 needs changes'—but which version are they looking at? You've looked at Databox, AgencyAnalytics—but €500/month when you just need organized workflows is excessive. You need one place where every report, every revision, and every client question is tracked.

problem.identify()
The Real Cost of Spreadsheet-Based Report Production
Report Status Archaeology = €2,400/Quarter in Coordination Overhead
Analytics director asks 'Where's the March report for Acme?' Analyst checks email, Slack, shared drive. 15 minutes later: 'Data extraction is done, analysis started yesterday.' Multiply by 30 reports. 30 × 15 min × 4 weeks × €65/hour = €1,950/month in status-checking overhead that shouldn't exist.
Lost Client Questions = €3,600/Quarter in Frustrated Clients
Client emails 'Why did bounce rate spike in week 2?' Account manager forwards to analyst. Analyst says 'I'll include it in next month's report.' Question lives in email. Next month: question not addressed. Client asks again—frustrated. 3 clients/quarter lose trust over missed questions. 1 churns annually = €3,600 in lost retainer revenue directly attributable to 'we forgot your question.'
Version Confusion = €1,800/Quarter in Rework
Client says 'page 7 needs the conversion table updated.' Which version is page 7? Email has Report_v2_FINAL.pdf. Client has Report_v2.pdf. Analyst updates wrong version. Client reviews, finds old data. Rework: 3 hours. Happens 4 times/month. 4 × 3 hours × €50/hour analyst rate × 3 months = €1,800 in version-confusion rework.
Quality Inconsistency = €2,400/Quarter in Client Complaints
Senior analyst reports have strategic insights. Junior analyst reports have data dumps. No templates, no checklists, no quality standards. Client complains: 'Last month's report was actionable. This month's is just charts.' You escalate, senior spends 4 hours fixing. 4 × 4 hours × €95/hour × 3 months = €4,560 in quality rescue work that templates would prevent.
Sound familiar?
See how GitScrum handles this in 2 minutes.
solution.implement()
Every Report Tracked, Every Question Captured, Every Revision Visible
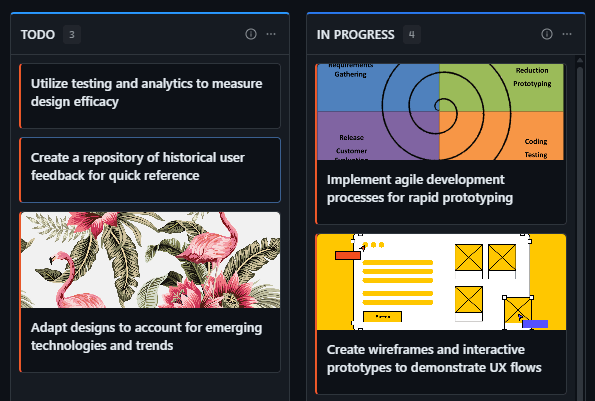
Visual Report Pipeline = Zero Status Meetings
Every report is a card. Columns: Data Extraction → Analysis → Draft → Client Review → Approved. Drag cards as work progresses. Analytics director sees all 30 reports at once: 8 in extraction, 12 in analysis, 6 in review, 4 approved. Zero 'where's the report?' conversations.
Client Question → Task = Zero Forgotten Questions
Client asks about a metric? Create task, link to their report. Task appears in 'Open Questions' column. When building next month's report, analyst sees: '3 questions to address.' Question answered in report? Mark complete. Nothing lives in email anymore.
Client Portal = Zero Version Confusion
Client reviews report in branded portal. Comments appear as tasks: 'Page 7: Update conversion table.' You see exactly what they're commenting on—their current view. No PDF attachments, no 'which version?' conversations. Revisions tracked, visible, actionable.
Report Templates + Checklists = Consistent Quality
Document your report framework in wiki: executive summary structure, required metrics, insight format. Checklist: 'Includes YoY comparison? Includes actionable recommendation? Reviewed by senior?' Junior follows template. Quality is consistent. No more 'fix this report' fire drills.
These solutions work together. Try them today.
Team size GitScrum is built for
For teams up to 2 users
Per user, per month
"We stopped losing hours to status meetings. Now everyone sees progress in real-time."
Sarah Chen
Operations Lead, 15-person team
Frequently Asked Questions
Still have questions? Contact us at customer.service@gitscrum.com
Does this integrate with our data tools (GA4, Looker, etc.)?
GitScrum manages workflow—not data extraction. Continue using your data connectors and visualization tools. GitScrum tracks whether data extraction is complete, analysis is done, and report is approved. It's your production management layer, not a replacement for analytics platforms.
We have clients on weekly, monthly, and quarterly schedules. Can we handle that?
Yes. Each client's report is a card. Set different columns or tags for cadence. Filter by 'due this week' to see only current deliverables. The board shows what's due regardless of individual client schedules.
Can we track time per client for profitability analysis?
Yes. Time tracking links to clients and reports. See which clients consume more analyst hours relative to their retainer. Use data for pricing conversations and capacity planning.
What about automated report generation tools?
If you're using automated dashboards (Databox, AgencyAnalytics), GitScrum isn't necessary—your reports self-generate. GitScrum is for agencies producing custom analysis reports that require human insight, not automated metric aggregation.
Ready to solve this?
Start free, no credit card required. Cancel anytime.


