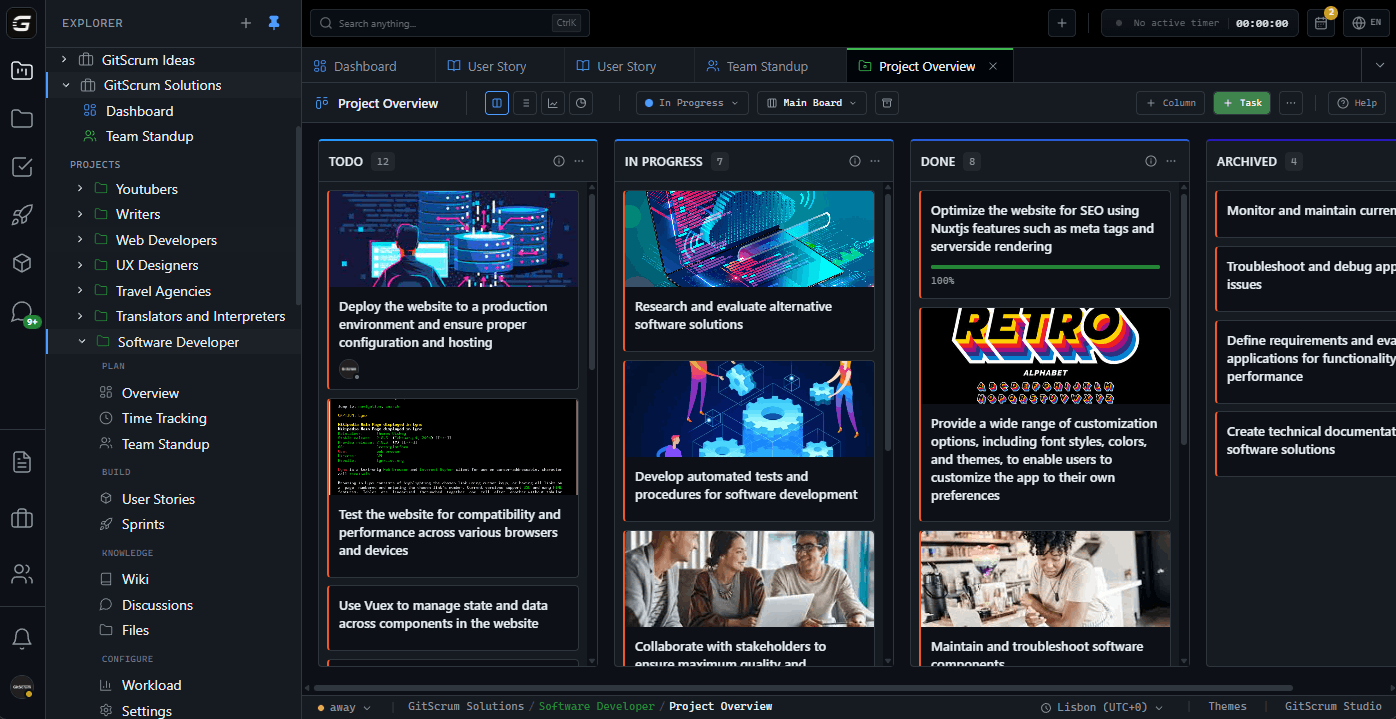
Deployment backlogs are often invisible—stakeholders see velocity metrics showing work completed, but don't see the queue of features waiting to reach users.
GitScrum makes this value delivery gap visible. Kanban boards show task counts in each workflow column, immediately revealing accumulation in Done or deployment-stage columns.
Dashboard widgets display task distribution by workflow, creating visual representation of where work sits in the pipeline. Project analytics provide percentage breakdowns by column state, quantifying the deployment bottleneck.
Custom workflow columns like 'Awaiting Deploy', 'In Staging', 'Ready for Production' model the full delivery pipeline visually. Labels can categorize deployment queue items by release batch, priority, or blocking reason—filterable views show the queue composition.
Sprint KPI velocity compared against deployment column throughput reveals the accumulating gap between completion and delivery. Activity heatmaps show the difference between development activity and deployment activity.
The GitScrum Advantage
One unified platform to eliminate context switching and recover productive hours.