PRO Annual — 50 users, $106.80/year

GitScrum logo
Solution

Velocity Cliff Prevention 2026 | 80 to 30 Points

Velocity crashes 80 to 30 points suddenly. Sprint health shows early warnings—scope changes, WIP buildup, blocked tasks—before cliff happens. Free trial.

Velocity Cliff Prevention 2026 | 80 to 30 Points
PRO Annual
$106.80/year · 50 users · no per-seat
Get PRO Annual

Velocity cliff drops are among the most damaging sprint failures.

One sprint the team delivers their typical 70-80 points, next sprint they barely hit 30. Stakeholders who planned based on consistent delivery suddenly face major delays.

What causes these cliffs? Often it's a combination of factors that compound: key team members unexpectedly out, scope changed significantly mid-sprint, multiple tasks blocked by external dependencies, technical debt finally catching up.

The problem isn't that these things happen—they always do. The problem is no visibility until it's too late.

GitScrum's sprint health analysis shows leading indicators: team health (capacity changes), scope health (mid-sprint additions), velocity tracking against historical average, blocked tasks accumulating. When multiple indicators turn yellow or red mid-sprint, you have time to course-correct: reduce scope, unblock tasks, bring in help.

Early warning prevents cliff drops from becoming surprises.

The GitScrum Advantage

One unified platform to eliminate context switching and recover productive hours.

01

problem.identify()

The Problem

Velocity suddenly drops 50%+ with no warning—stakeholder trust evaporates

No visibility into leading indicators—problems only visible at sprint end

Scope changes mid-sprint go untracked until velocity impact is obvious

Blocked tasks accumulate silently without surfacing as a risk

Root cause of velocity drops unclear—was it capacity, scope, or blockers?

02

solution.implement()

The Solution

Sprint health dashboard shows team, scope, time, and quality health scores

Velocity comparison to historical average surfaces underperformance early

Scope change tracking counts tasks added after sprint start

WIP (work in progress) metric highlights task accumulation in middle columns

Burndown chart mid-sprint trajectory shows if delivery is at risk

03

How It Works

1

Monitor Sprint Health Dashboard

GitScrum's sprint health shows four health dimensions: Team (capacity/availability), Scope (changes since start), Time (days remaining vs work remaining), Quality (defects/rework). Each gets a percentage score and status (healthy, warning, critical).

2

Track Velocity Against Historical

Current sprint velocity is continuously compared to historical average. 'Current velocity (25) is 45% lower than historical average (45).' This surfaces underperformance mid-sprint, not at the end when it's too late.

3

Watch Scope Change Percentage

GitScrum counts tasks added after sprint start. '20% of current work was added mid-sprint.' High scope change explains velocity drops—the team didn't slow down, they took on more work. Address at the source.

4

Monitor WIP Accumulation

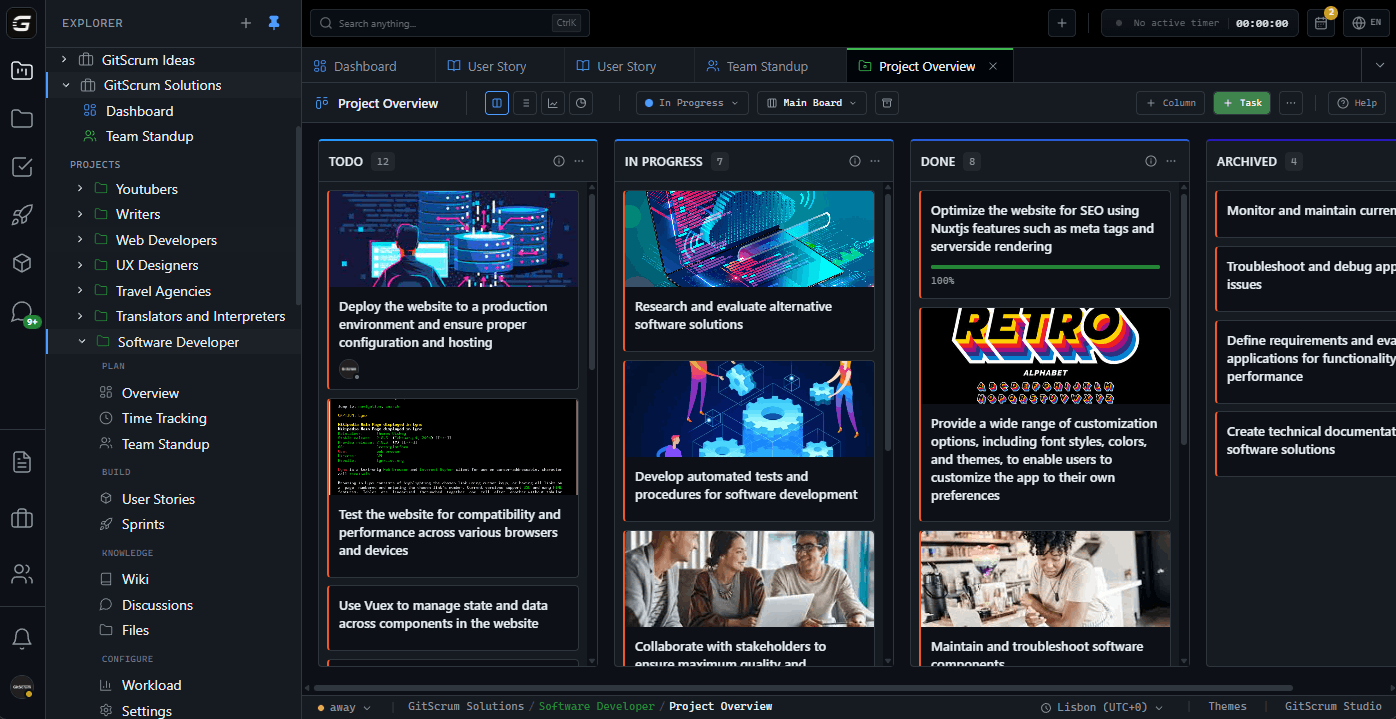
Work in Progress metric shows tasks started but not completed. High WIP (many tasks in 'In Progress') indicates flow problems—tasks blocked, context switching, or over-commitment. Reduce WIP to restore flow.

5

Check Burndown Trajectory

Burndown chart shows ideal vs actual task completion. If actual line is significantly above ideal mid-sprint, delivery is at risk. Course-correct: cut scope, resolve blockers, or reset expectations with stakeholders.

04

Why GitScrum

GitScrum addresses Preventing Velocity Cliff Drops in Agile Sprints through Kanban boards with WIP limits, sprint planning, and workflow visualization

Problem resolution based on Kanban Method (David Anderson) for flow optimization and Scrum Guide (Schwaber and Sutherland) for iterative improvement

Capabilities

  • Kanban boards with WIP limits to prevent overload
  • Sprint planning with burndown charts for predictable delivery
  • Workload views for capacity management
  • Wiki for process documentation
  • Discussions for async collaboration
  • Reports for bottleneck identification

Industry Practices

Kanban MethodScrum FrameworkFlow OptimizationContinuous Improvement

Frequently Asked Questions

Still have questions? Contact us at customer.service@gitscrum.com

What qualifies as a velocity 'cliff drop'?

Generally, a 40%+ drop from recent average is a cliff. If your team typically delivers 60-70 points and suddenly hits 30, that's a cliff. GitScrum's historical comparison makes this easy to spot—percentage change from historical average surfaces it automatically.

How early can GitScrum detect a potential cliff?

Mid-sprint, usually by day 3-5 of a 2-week sprint. Sprint health indicators, burndown trajectory, and velocity-to-date vs historical all provide early signals. The key is checking these metrics regularly, not just at sprint end.

What should we do when we see warning signs mid-sprint?

Options: 1) Cut scope—move non-critical items to next sprint. 2) Unblock—swarm on blocked tasks to get them moving. 3) Reset expectations—communicate revised forecast to stakeholders early. Early action prevents surprises.

Can we prevent all velocity cliffs?

No—some factors are genuinely unpredictable (key developer illness, major production incident). But most cliffs come from accumulating problems: scope creep, blocked tasks, WIP buildup. GitScrum makes these visible early so you can act.

How do scope changes affect velocity interpretation?

High scope change can make velocity look artificially low. If team completed 50 points but 15 were added mid-sprint, they actually performed better than the number suggests. GitScrum tracks scope change separately so you can factor it in.

Ready to solve this?

Start free, no credit card required. Cancel anytime.

Works with your favorite tools

Connect GitScrum with the tools your team already uses. Native integrations with Git providers and communication platforms.

GitHubGitHub
GitLabGitLab
BitbucketBitbucket
SlackSlack
Microsoft TeamsTeams
DiscordDiscord
ZapierZapier
PabblyPabbly

Connect with 3,000+ apps via Zapier & Pabbly